FEATURES
Packed with powerful features to help you find the perfect companies to invest in
Research Tools
-
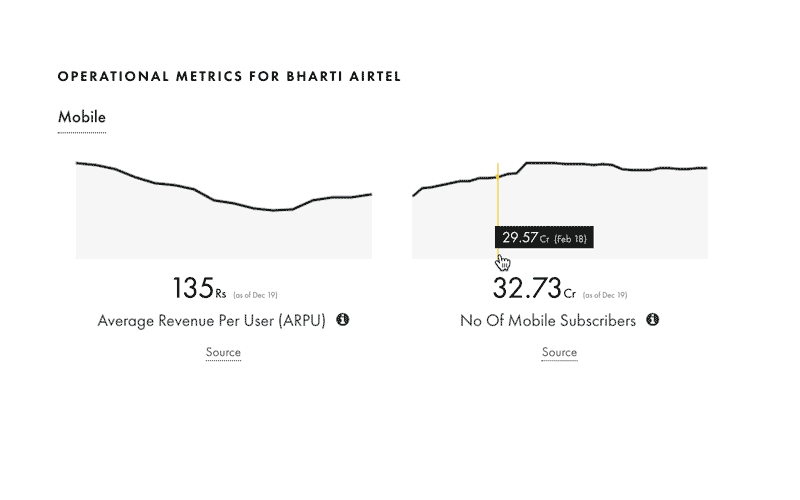
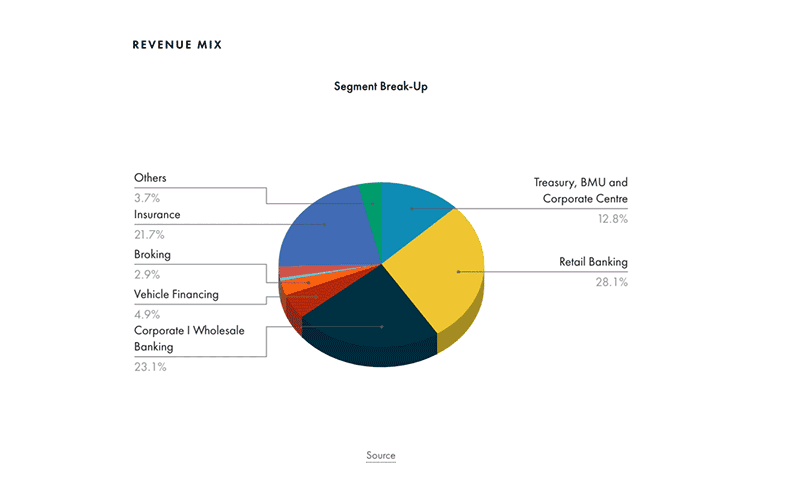
Operational MetricsAnalyze critical operational metrics of a company & compare it against their closest competitors
-
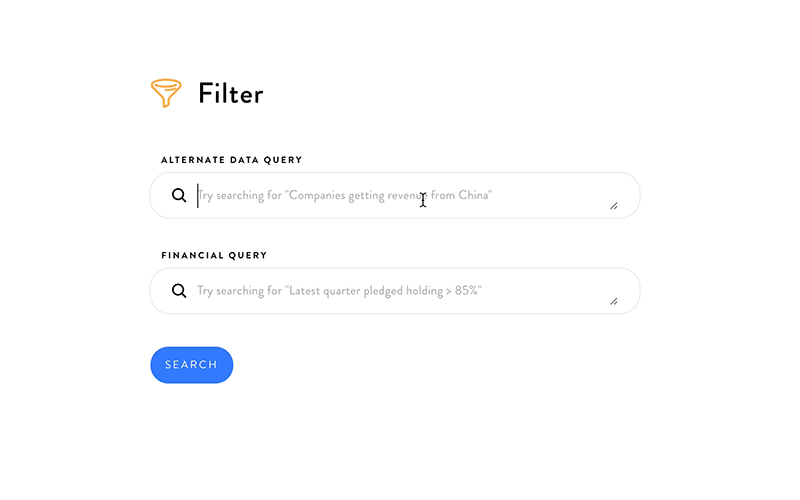
FilterDiscover new companies to invest in by filtering in simple natural language
-
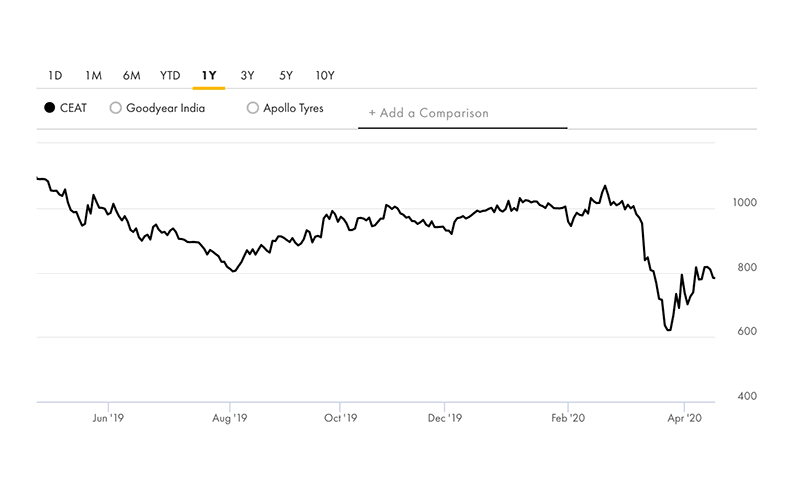
SourceGo deeper in your research by clicking on source. This takes you straight to the base source of the data
-
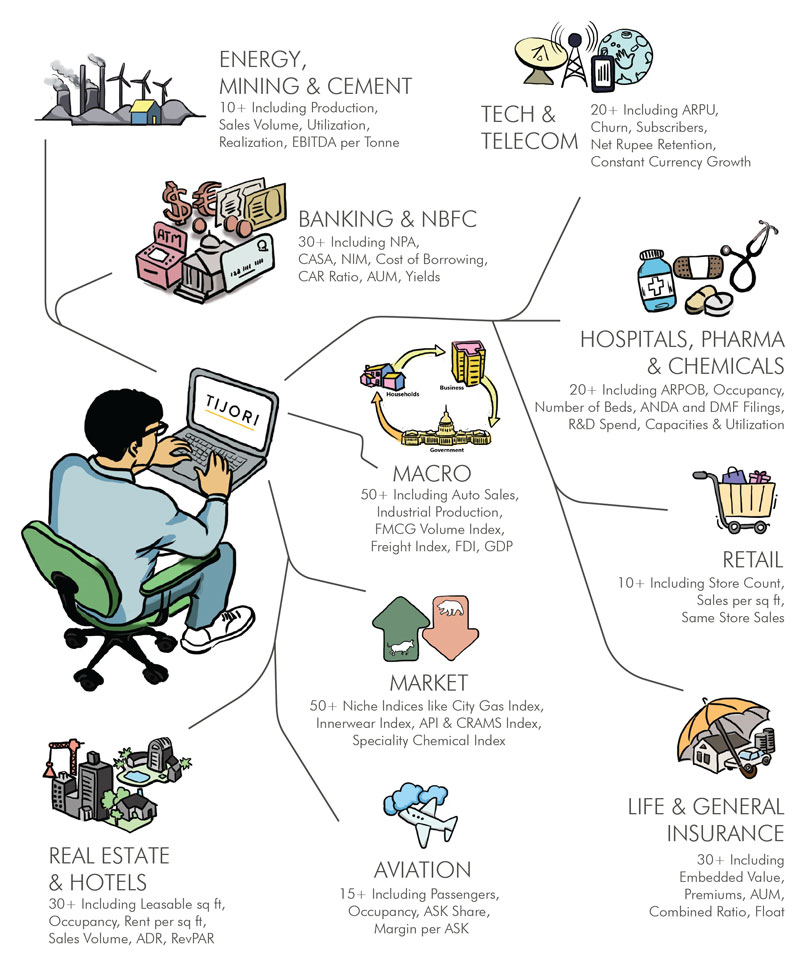
Sector DataAnalyze the performance of over 20 sectors covered on Tijori
-
TJI IndexesMake your company’s benchmarking more relevant by comparing against niche sector specific indices.
-
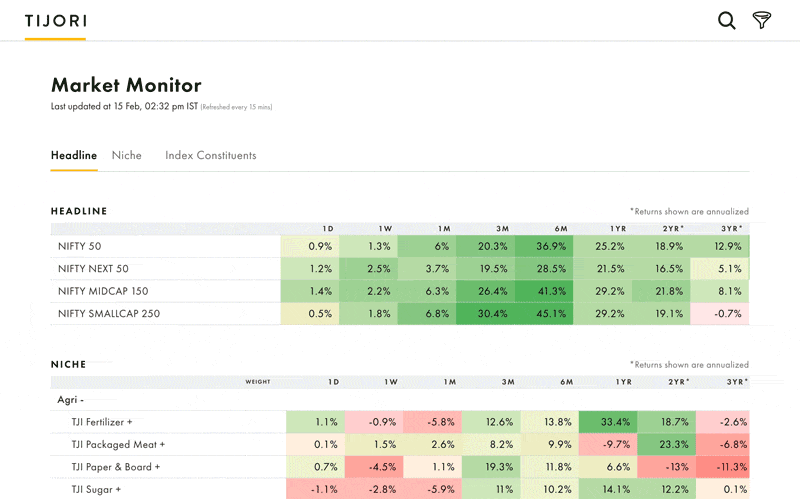
Market MonitorMonitor performance across sectors
-
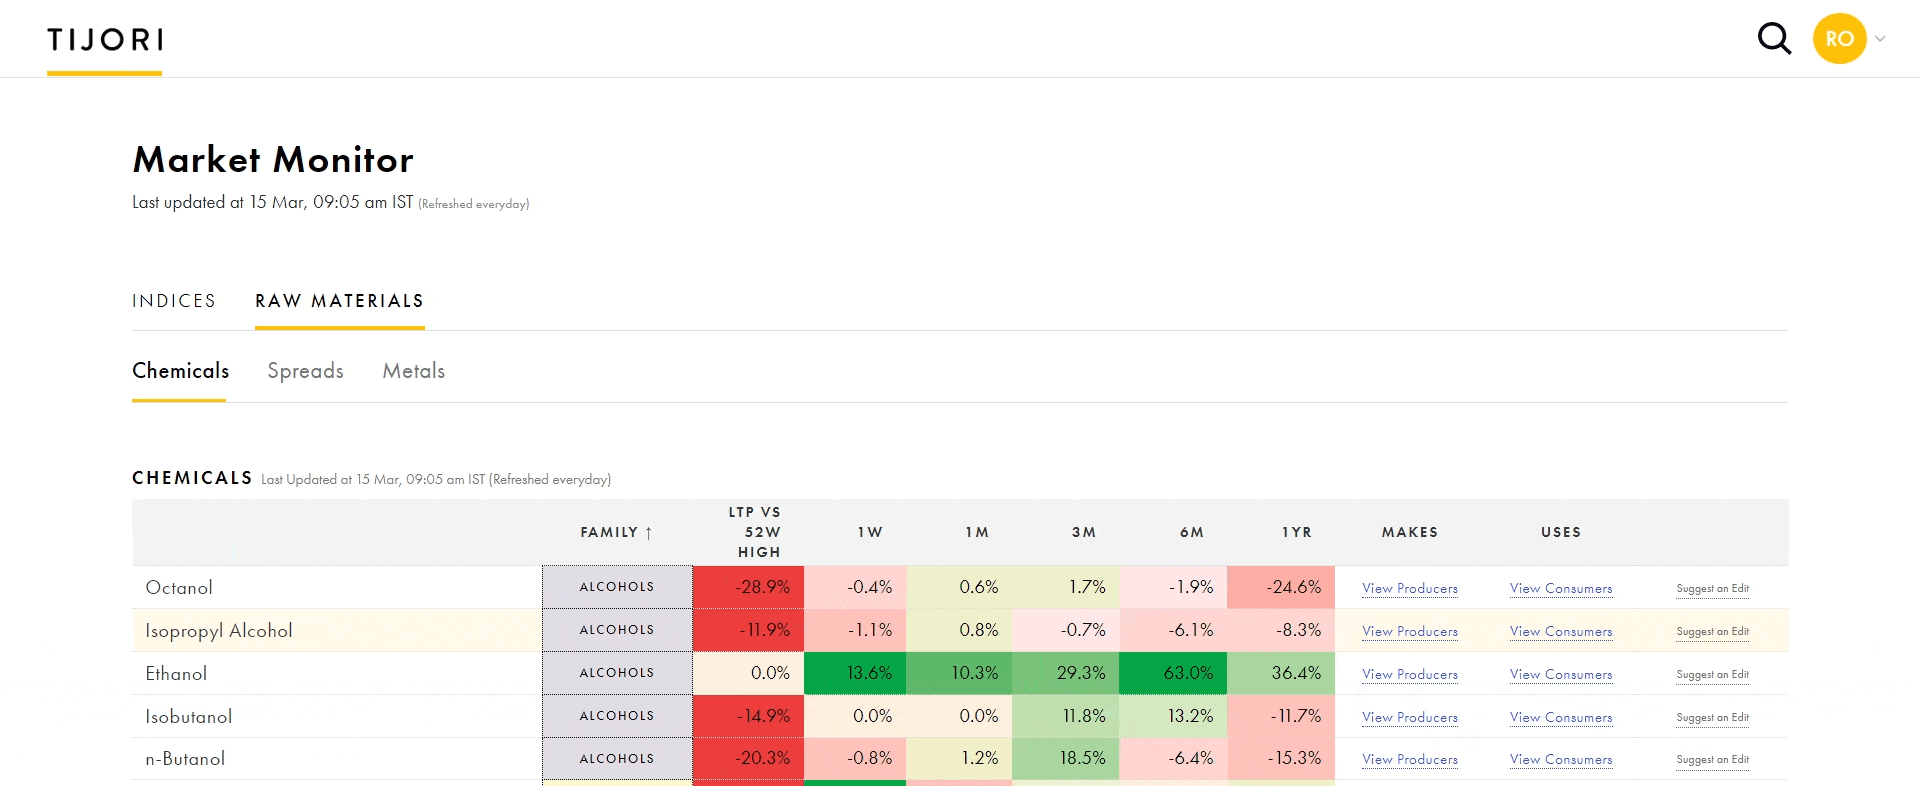
Raw MaterialsTrack price movements of key raw materials
-
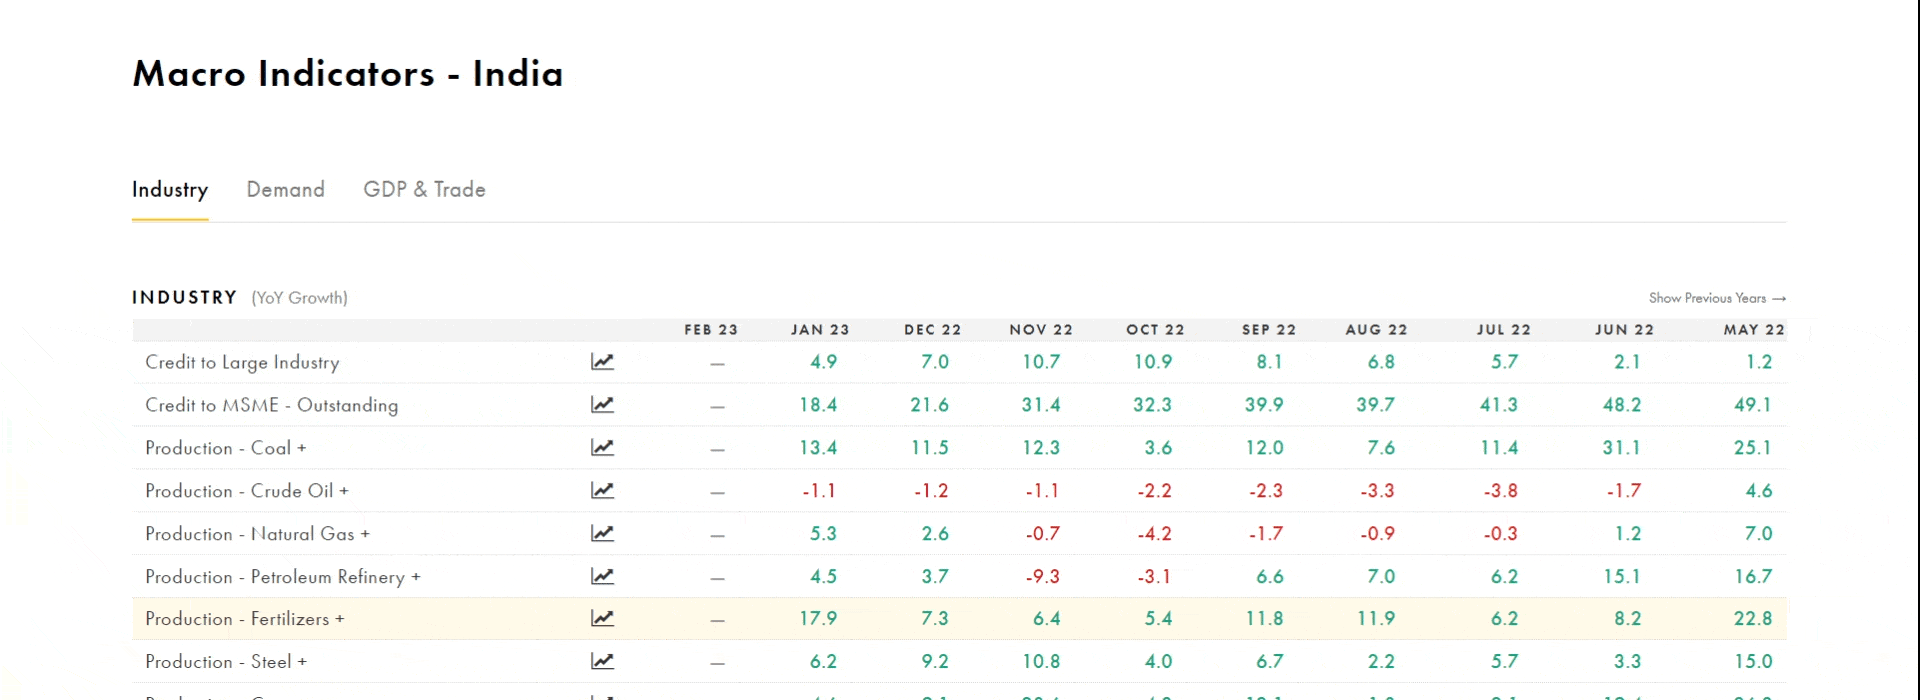
Macro IndicatorsView macro-economic data sets which provides a high-level view of the economy
Analyze critical operational metrics of a company & compare it against their closest competitors
Discover new companies to invest in by filtering in simple natural language
Go deeper in your research by clicking on source. This takes you straight to the base source of the data
Analyze the performance of over 20 sectors covered on Tijori
Make your company’s benchmarking more relevant by comparing against niche sector specific indices.
Monitor performance across sectors
Track price movements of key raw materials
View macro-economic data sets which provides a high-level view of the economy
Tracking Tools
-
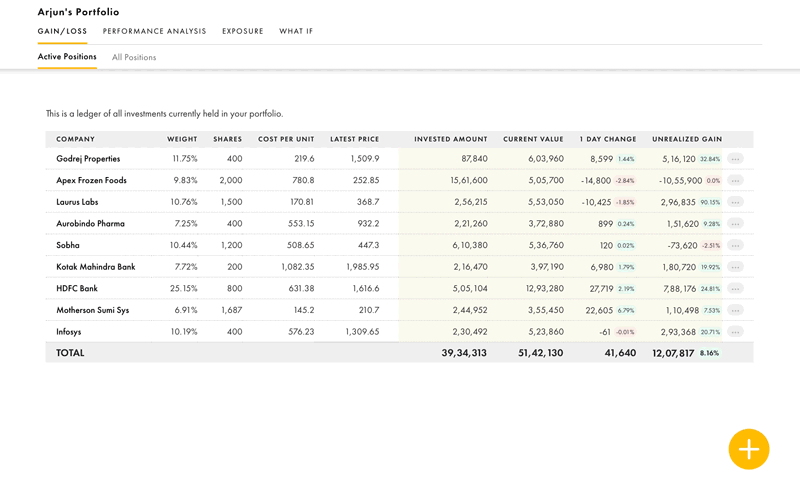
PortfolioKeep an eye on your investments and track of your exposure & risk
-
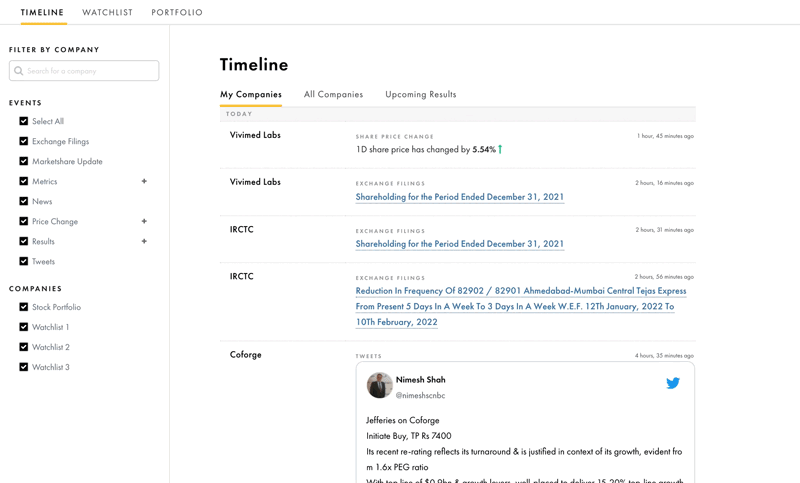
TimelineGet updates on exchange filings, marketshare and business changes, tweets and news about your companies in a personalised feed
-
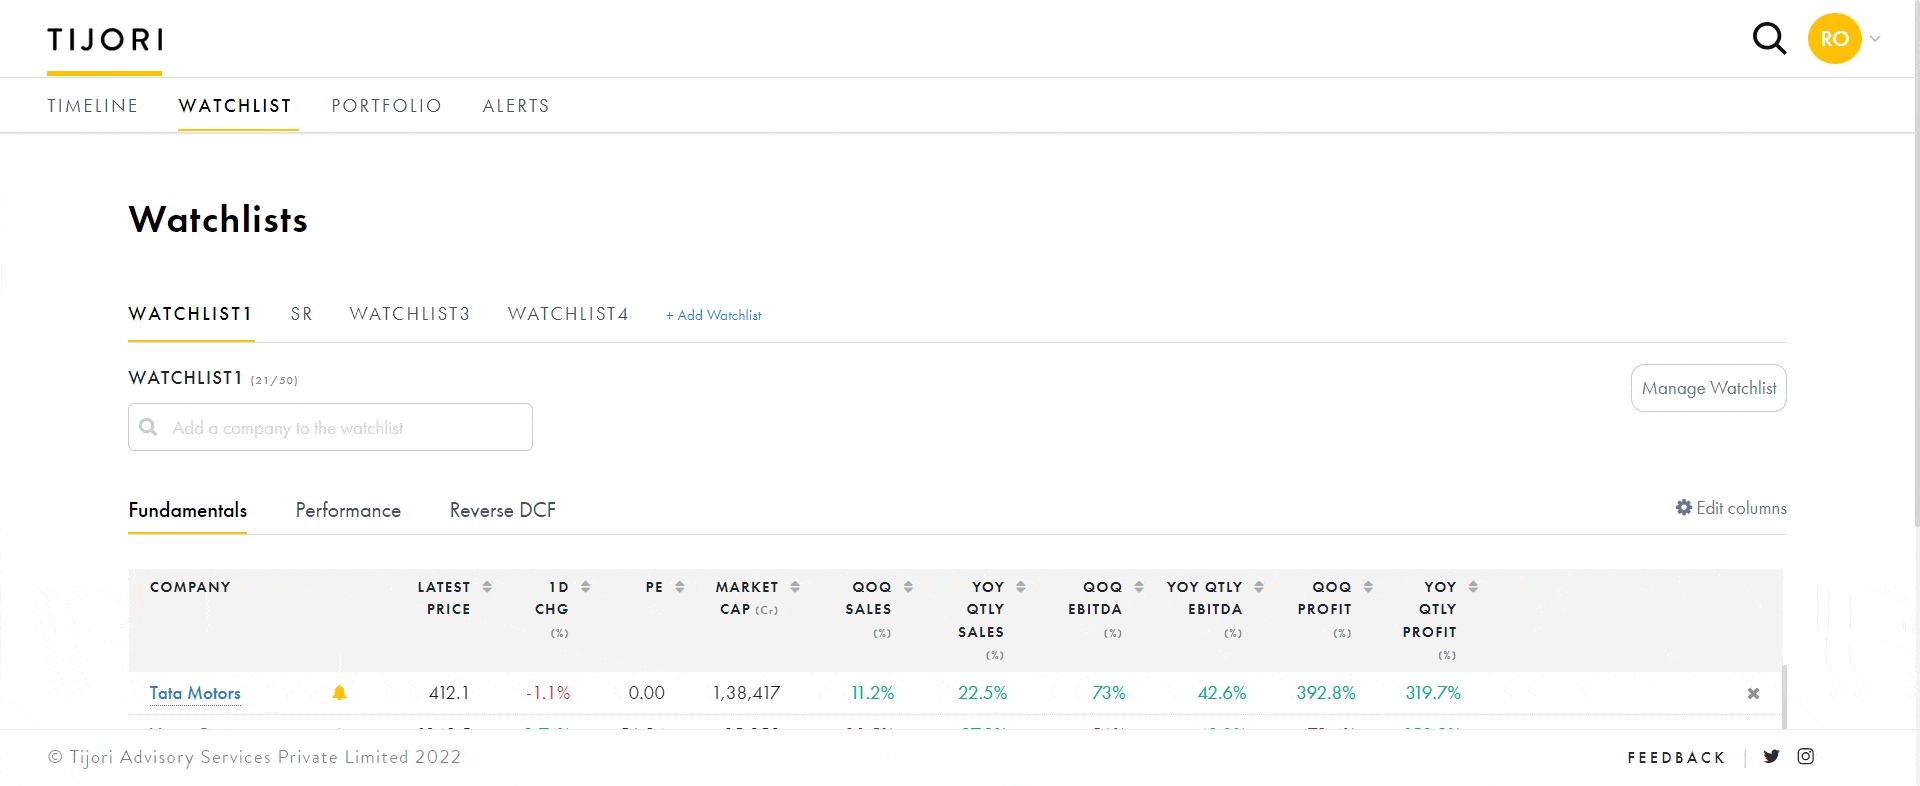
WatchlistFollow your favourite stocks and make more informed trades by creating watchlists
-
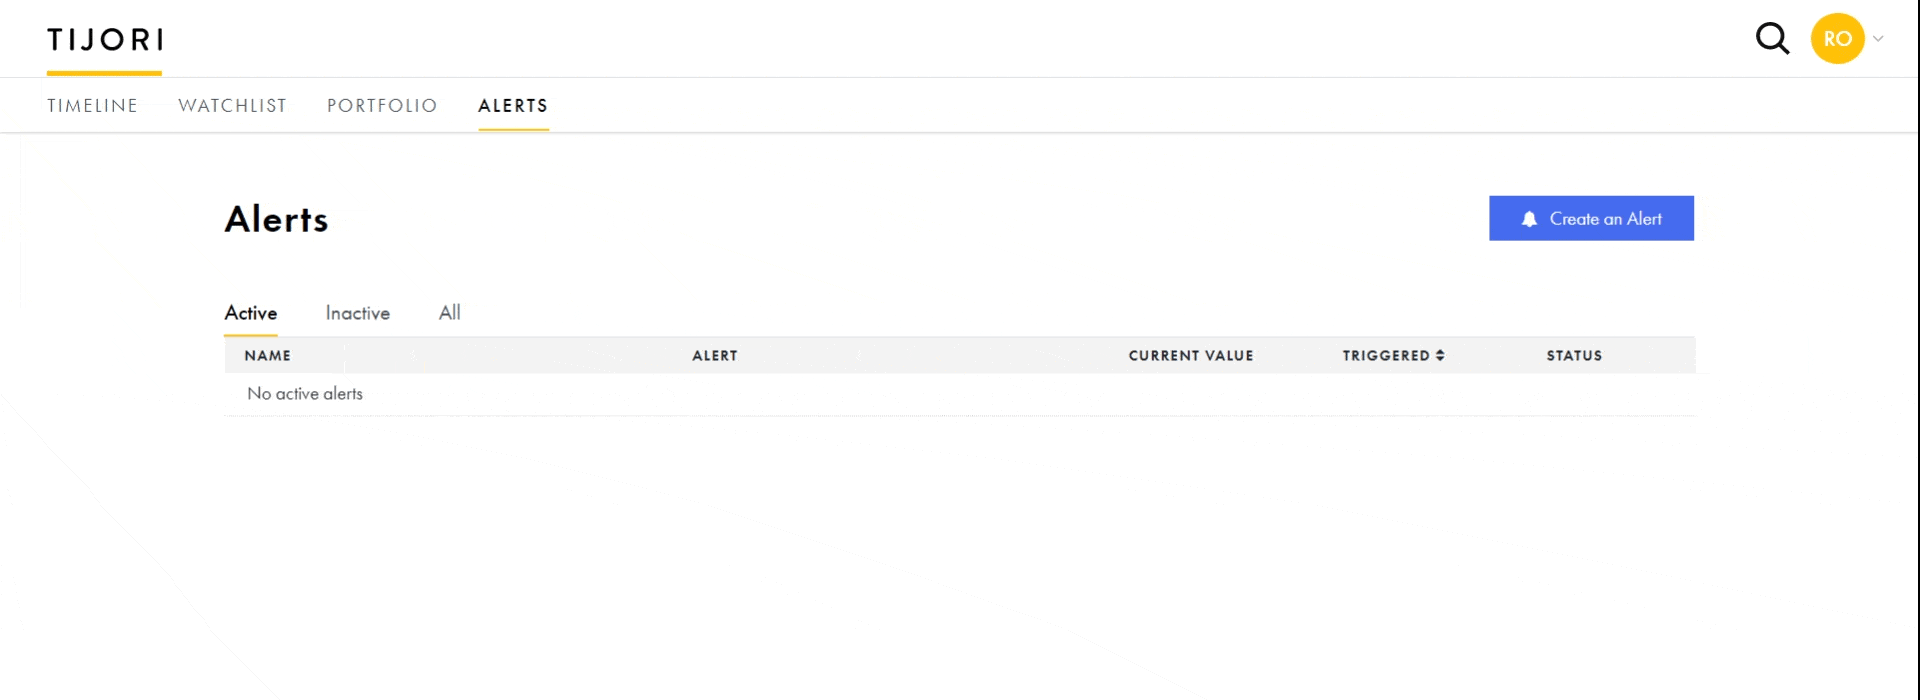
AlertsAdd price/volume alerts and get notified when they are hit
Keep an eye on your investments and track of your exposure & risk
Get updates on exchange filings, marketshare and business changes, tweets and news about your companies in a personalised feed
Follow your favourite stocks and make more informed trades by creating watchlists
Add price/volume alerts and get notified when they are hit