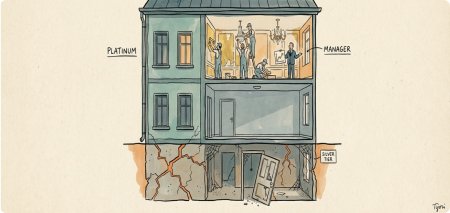
5-Year Revenue & EBITDA Estimates: Growth Sputters to 12% — Can ARPU
Expansion Offset Stagnant Supplier Additions?
Executive Snapshot:
-
Thesis: Indiamart is transitioning from a volume-led growth story
to an ARPU-led cash compounder. With standalone collection growth decelerating to
8% (Q2 FY26) and paying supplier growth nearly stalling (+2% YoY), the company is
relying heavily on pricing power within its Gold/Platinum tiers (Top 10% contribute
~47% of revenue).
-
Key Driver: ARPU Expansion (~65% of future growth). With volume
growth capped by high churn in the 'Silver' bucket, future revenue hinges on moving
existing 222K suppliers up the value chain.
-
Critical Dependency: Churn Management. Management has admitted that
churn in the monthly/annual Silver bucket remains “stubborn.” If this
bleeds into Gold/Platinum tiers, the thesis breaks.
-
Watch: Standalone Collection Growth, currently lagging at 8-10%;
needs to cross 15% to justify premium valuations.
Competitive Position & Scenario Probabilities
Competitive Position: Wide Moat (Network Effects) — The platform holds a dominant
liquidity advantage with 222K paying suppliers and 42M active buyers. However, the moat
is Stable rather than widening. While network effects protect against new entrants, they
are not currently driving new usage velocity at the bottom of the pyramid
(Silver tier churn is high), indicating saturation or value-proposition mismatch for
smaller SMEs.
| Scenario |
Probability |
Key Drivers |
| Base Case |
55-60% |
Supplier base grows 3-4% CAGR; Revenue growth driven by 8-10% ARPU hikes;
Margins stabilize ~35% due to reduced acquisition spend.
|
| Bear Case |
25-30% |
Elevated risk. Triggered if Standalone Collections growth stays <10% for 2
more quarters OR if entry-level churn forces price rollbacks. (See Section 5).
|
| Bull Case |
15-20% |
Requires specific breakout in 'Busy Infotech' scaling (>30% CAGR) AND
successful stabilization of Silver bucket churn leading to >6K net
adds/quarter.
|
Probability Rationale
Base case probability is anchored by the persistent disconnect between management's
aspiration (20%+ growth) and actual delivery (12% Consolidated Revenue growth in Q2
FY26). The Bear case is elevated above standard 20% because the core standalone engine
shows signs of saturation (net additions were negative in Q3 FY25 and only modestly
recovered to +2.8K in Q2 FY26).
Financial Estimates Table (FY26E - FY30E)
Note: Base Year FY25 Actuals used. FY26 estimates annualized based on H1 FY26 actuals
(Q1+Q2).
| Metric |
FY25 (A) |
FY26 (E) |
FY27 (E) |
FY28 (E) |
FY29 (E) |
FY30 (E) |
CAGR |
| Revenue (Rs. Cr) |
| - Base Case (55-60%) |
1,388 |
1,585 |
1,805 |
2,055 |
2,340 |
2,665 |
13.7% |
| - Bear Case (25-30%) |
– |
1,550 |
1,675 |
1,810 |
1,935 |
2,050 |
8.1% |
| - Bull Case (15-20%) |
– |
1,620 |
1,945 |
2,330 |
2,800 |
3,360 |
19.3% |
| EBITDA (Rs. Cr) |
| - Base Case (55-60%) |
523 |
555 |
650 |
780 |
915 |
1,065 |
15.2% |
| - Bear Case (25-30%) |
– |
535 |
550 |
580 |
600 |
615 |
3.8% |
| - Bull Case (15-20%) |
– |
580 |
740 |
930 |
1,150 |
1,410 |
22.0% |
| EBITDA Margin |
37.7% |
35.0% |
36.0% |
38.0% |
39.1% |
40.0% |
|
| PAT |
551 |
580 |
675 |
810 |
960 |
1,120 |
15.2% |
| PAT Margin |
39.7% |
36.6% |
37.4% |
39.4% |
41.0% |
42.0% |
|
Growth Decomposition: Source of Rs.1,080 Cr Revenue Growth (FY25 to FY30)
This section breaks down the total projected revenue increase (Base Case) into its
component drivers.
ARPU Expansion & Tier Migration (~60% / Rs.648 Cr)
- Assumed CAGR: 8%
- Base (FY25): Annualized Revenue per Supplier Rs.61K.
- Target (FY30): ~Rs.90K.
-
Rationale: Top 10% of customers contribute ~47% of revenue. Growth relies on
migrating Silver users to Gold/Platinum. Pricing power remains intact in the top
tier despite churn at the bottom.
Net New Supplier Volume (~20% / Rs.216 Cr)
- Assumed CAGR: 3%
- Base (FY25): 217K Paying Suppliers.
- Target (FY30): ~255K Paying Suppliers.
-
Rationale: Q2 FY26 Net adds were only ~2.8K (normalized). High churn in the 'Silver'
monthly bucket severely caps volume growth. Est assumes modest recovery but no
return to pre-2022 volume velocity.
Accounting Software (Busy Infotech) (~15% / Rs.162 Cr)
- Assumed CAGR: 22%
- Base (FY25): ~Rs.66 Cr Rev (Busy).
- Target (FY30): ~Rs.228 Cr.
-
Rationale: Busy Q2 FY26 billing grew 57% (normalized). This segment is growing
faster than core B2B but on a smaller base.
Other Income/Adjacencies (~5% / Rs.54 Cr)
- Assumed CAGR: 10%
-
Rationale: Incremental revenue from Vyapar, Livekeeping, and new SaaS initiatives.
Key Assumptions & Risk Assessment
4.1 Revenue Growth Assumptions
-
Supplier Stagnation: Projections assume paying suppliers grow at a
pedestrian 3-4% CAGR. Management's pivot to “quality over quantity”
(reducing suppliers introduced per buyer from 9-10 to 4-5) explicitly limits volume
explosion to preserve buyer experience.
-
Pricing Power: Assumes 6-8% annual ARPU increase. If macro headwinds
force a price rollback to retain Silver customers, the Base Case is invalid.
-
Busy Infotech: Assumed to grow at 20%+; however, recent policy
changes (channel partner payout restructuring in Nov '24) create short-term noise.
4.2 Margin Trajectory Rationale
-
Cost Control Floor: Q2 FY26 EBITDA margin was ~33% (Consolidated)
and ~32% (Standalone). Management guided that margins remain elevated due to
lower subscriber acquisition costs (deliberately slowing sales spend).
-
Terminal Margin: Capped at 40%. The business has immense operating
leverage, but sustaining >40% usually invites aggressive competition or requires
massive reinvestment.
4.3 Key Risks to Estimates
-
Churn Persistence: If churn moves from the “Silver”
bucket (entry-level) to the “Gold” bucket, the 60% revenue driver (ARPU)
collapses.
-
Collections Lag: Standalone collections grew only 8% in Q2 FY26.
Revenue lags collections. If collections don't accelerate, FY27 revenue estimates are
at risk.
4.4 Execution/Credibility Note
-
Adjustment Applied: Estimates are heavily discounted from implied
management aspirations. While management targets “double-digit” customer
growth historically, actual net adds (2K-3K/quarter) imply only ~4-5% growth. We have
modeled the actual trajectory (3-4%), not the aspiration.
4.5 Data Limitations
-
Churn Granularity: Exact churn rates by specific tier (Silver Monthly
vs Annual vs Gold) are not disclosed, forcing analyst estimates based on qualitative
commentary.
Scenario Triggers
Bear Case (FY30 Revenue Rs.2,050 Cr, 25-30% Prob):
-
Trigger 1: Standalone Collections growth drops below 5% for two consecutive quarters
(indicating pricing power exhaustion).
-
Trigger 2: Net Paying Supplier additions turn negative again (as they did in Q3
FY25), shrinking the base to <210K.
Bull Case (FY30 Revenue Rs.3,360 Cr, 15-20% Prob):
-
Trigger 1: “Busy Infotech” billing growth accelerates >30%
sustainably, becoming a material revenue pillar (>10% of consol revenue).
-
Trigger 2: Silver tier churn reduces significantly due to product interventions,
returning net supplier additions to >6K/quarter.
Analyst Watchlist
-
Standalone Customer Collections (Q3/Q4 FY26): Must exceed 12% YoY
growth. Current 8% growth (Q2 FY26) is a flashing yellow light for future revenue.
-
Net Paying Supplier Additions: Watch if this metric stabilizes above
4,000/quarter. The Q3 FY25 dip (-3.5K) and Q2 FY26 recovery (+2.8K normalized) show
volatility.
-
Busy Infotech Billing: Monitor the “normalized” growth
post-channel partner payout restructuring. If it sustains >40%, this could re-rate
the multiple.
-
Unique Business Enquiries: Growth here (12% in Q2 FY26) is healthy.
If this decouples from supplier growth, it indicates a monetization failure, not a
traffic failure.
Report is AI-generated and may contain inaccuracies. Analysis based on regulatory filings
up to 2 hours prior to request.